Top Travel Behaviors in Europe 2025
I’m excited to share a recent infographic project that dives deep into the ‘Top Travel Behaviors in Europe for 2025’. This project allowed me to combine my passion for data analytics with effective visual communication, transforming complex market research into an easily digestible and engaging visual story.
The Challenge: Making Data Accessible
The goal was to present multifaceted trends in European travel – covering everything from evolving budget strategies to new destination preferences and the growing influence of sustainability – in a clear, impactful way. The sheer volume of data from various reports on 2025 travel behaviors required careful curation and a strong narrative approach.
My process is always driven by the end goal: clarity and impact.
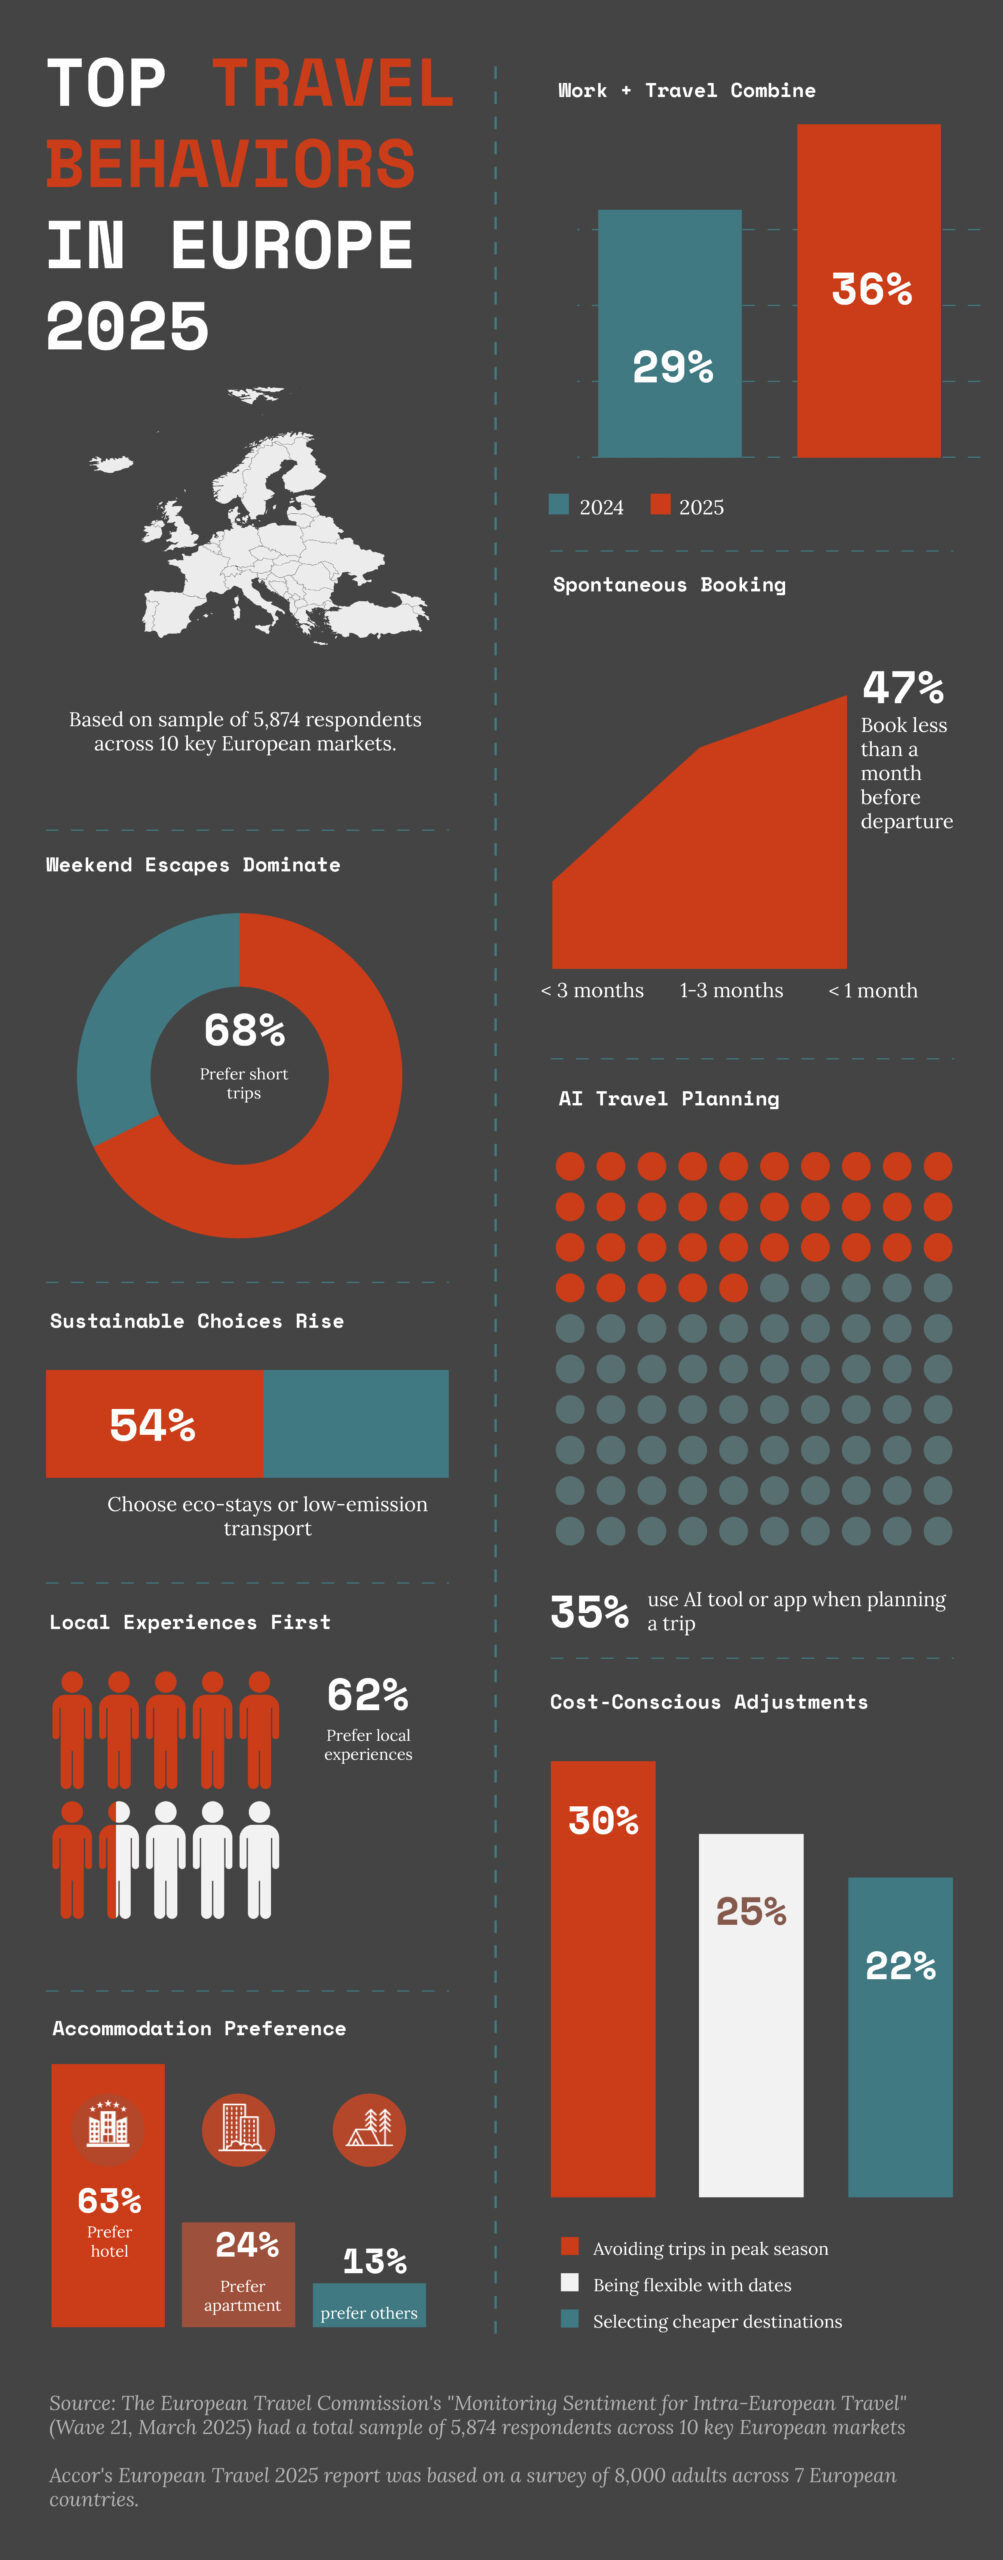
- Strategic Data Curation: I began by synthesizing data on 2025 travel behaviors from various sources. The goal was to identify the three most influential trends—cost-saving, accommodation choices, and sustainability—that would form the backbone of the visual story.
- Narrative Structuring: I structured the data to move logically from big picture (budget concerns) to specific actions (accommodation preference), ensuring a seamless flow that holds the viewer’s attention.
- Visual Problem-Solving (Infographic Design): The success of this project hinged on creative chart choices. For instance, using pictograms for accommodation preference was key to making dense percentages instantly relatable, showcasing my expertise in effective data visualization.